Healthcare Membership Options

Choose Membership Plan

Basic Membership

$100Month

  • Our basic membership includes access to
  • - our members only Community Forum section,
  • - Video and Classic training materials,
  • - our Newsletters,
  • - Podcasts and
  • - Articles written specifically to address your practice issues.
  • Basic members also have the opportunity to work one on one with Lee in limited Zoom sessions. All sessions are recorded and available to all basic members so we can share the learning generated in the BR community.

Value Membership

$500Month

  • Our best value membership. Get all the Basic membership benefits, PLUS
  • - a customized "Readiness for Change" project, PLUS
  • - a level 1 Patient Care Value Stream AND
  • - a one hour Zoom meeting EVERY MONTH to help you integrate and align ALL your practice QI initiatives.
  • PCMH, MIPS, ACO, CPC+ initiatives can be duplicative and we help make sense of them all in the wider context of your practice's best direction for stability, balance and growth. These elements get your practice off the ground on a transformation program designed around the BR transformation methodology, created from the results of 30 years of working in organizational transformation and unique in the industry.

Premium Membership

$1500Month

  • Our Premium members receive everything in the Value membership package, PLUS
  • - extra one on one Zoom sessions on specific practice development areas, such as integration of behavioral health, HR issues and Revenue Cycle Management. It is the true custom support solution for strategically aligned QI in your practice. Think of this as your "On Demand Strategic and Operations Support System"
Membership

Transformation Club Membership Options

Vermont Covid-19 Infection Rates - Updated Daily

  • Category: Uncategorised
  • Published: Tuesday, July 07 2020 11:19
  • Written by Super User
  • Hits: 5480

The daily infection rate data for Vermont is now unavailable. I've written directly to the VDH and had no response, so unfortunately this control chart cannot be updated as at June 1 2022. I am disappointed, as I believe the current data presentation formats do not represent a true picture of the pandemic in Vermont. I'm hopeful that this will change in the future, but as of now, my unfortunate conclusion is that the public are being fed a false picture of the risks and progress of the SARS-COV2 pandemic. 

PLEASE stay safe. Wear the mask. Get the vaccinations. Minimize interactions, especially indoors with strangers. 

I'm going to be posting the most up to date version on this page daily (or as soon as I have the figures). Please feel free to email me if there are any questions at This email address is being protected from spambots. You need JavaScript enabled to view it.


UPDATE 5-12-22 - Lower restrictions, rate goes up, and up, and up...  

The last four weeks has seen a steady increase in infection rates across Vermont. The graphs above shows the net effect. The mean has increased to 327 per day, from 247 pr daywith upper control limits increasing to 564 per day from 412 per day. This is bad news in that the overall infection rate is rising once more. Our hospitalization numbers are also increasing. Currently we have 7 ICU beds occupied with Covid 19 patients, and a further 45 in general hospitalization. Our hospital system is under stress, and the increases will only exacerbate this. 

These are numbers on  VT Statewide basis, so this will vary significantly depending on location.  Please don't forget - this is a lagging indicator, so infection rate changes will not show up in this for a couple of weeks after any major shift. The sharp eyed among you will have noticed that the numbers tend to change daily also. This is because of the way the state of VT records cases as confirmed or probable, with some probably cases translating to confirmed cases in the days that follow the discovery.

There are 648 unfortunate Vermonters having departed since the start of the pandemic owing to Covid-19 in VT as of yesterday. The death rate is falling, but the numbers continue to increase. 

We now have clear evidence that when restrictions are lifted, infection rates spike. It happened on July 4th 2021, and again on Christmas day 2021. Both times saw significant spikes in infections a few days afterwards. We at Bryan Research urge the Governor to change course in his management of the pandemic in VT. Lifting all restrictions was the wrong decision - the numbers prove that. We are extremely concerned about the messaging being sent to the population of Vermont at this time. Until we reach herd immunity with vaccinations, our safety measures MUST be followed. 

I want to be really clear on something. THIS IS INEVITABLE WHEN OUR COLLECTIVE BEHAVIOR DOES NOT CHANGE. The virus doesn't care if you're Republican, Democrat, Old, Young, Male or Female. It only cares about infection and propagation. Reduce the number of opportunities it has to transmit to others. Wear a mask. Stay 6 feet apart. Don't congregate indoors. These are NOT political acts. 

I need to apologize for the decreased frequency of updates to this page. I have recently had to devote more time to work situations, which has led to less to devote to this. I am hoping update twice a week from now onwards. 


Covid-19 in Vermont

  • Category: Uncategorised
  • Published: Friday, July 03 2020 09:15
  • Written by Super User
  • Hits: 4559

In the second quarter of 2020, the Covid-19 pandemic ravaged the world causing enormous pain, suffering and death.

At the time of writing, around 10 million confirmed cases and 500,000 deaths have occurred worldwide, with more than 25% of those cases and deaths coming from the USA.

Obviously, the disease progresses at different rates depending on the socio-politico-economic conditions at any given location. New York City was particularly badly hit in the early stages, as the virus came in from Europe when everyone was expecting it to appear from Asia. The response from NY has been commendable, and they now have their numbers under control. State responses have varied widely, and this is now showing in the infection rates from those states. We could discuss the politicization of the pandemic with misinformation, radicalization and the influence of the Black Lives Matter movement, but that's a discussion for another day. What I'm concerned about primarily is how the pandemic is progressing in our base state of Vermont. 

The Vermont Response

Vermont recognized the potential impact of this disease early and was one of the first to institute a statewide "stay in place" order to attempt to control person to person interactions and therefore viral spread. Like many states, we prepared hospitals for the projected onslaught, created surge capacity by converting large buildings to emergency hospitals and cancelling elective surgeries. The projections at the start of the pandemic were truly horrific, being fed by a lack of knowledge about the virus, its rate and mechanism of transmission and effects on the body of humans in different demographics. As the world struggled to catch up, this knowledge was modified almost daily (sometimes hourly), and plans modified as a result. Luckily, in VT, we didn't get the huge surge of cases and deaths, although the prompt actions of our Governor and his advisors had a lot to do with that.
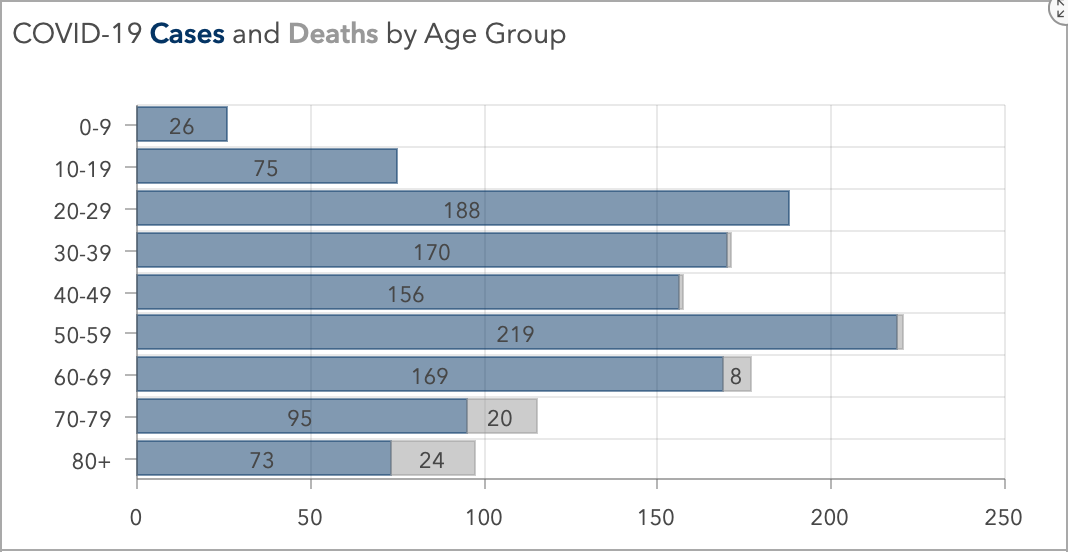
At the time of writing (July 3rd 2020) we have 56 unfortunate souls who have departed this mortal coil through this disease, from 1227 cases. The up to date figures are here.

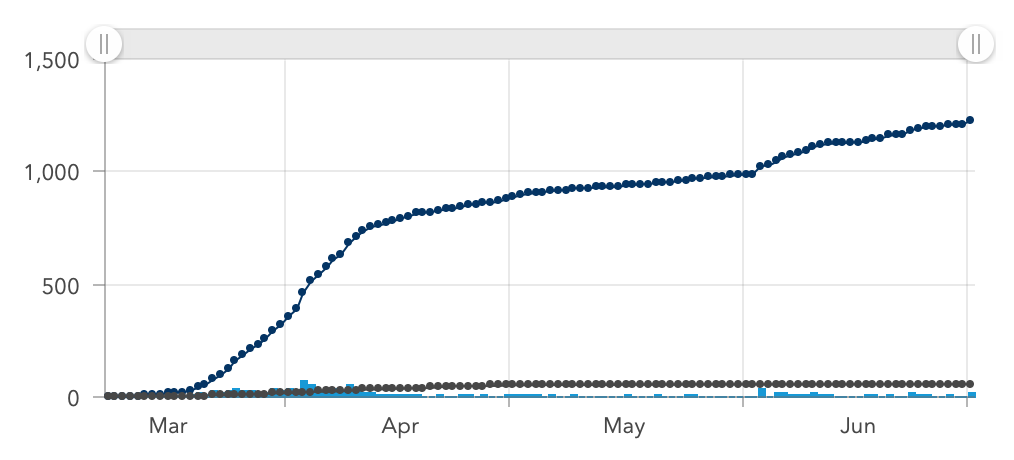
The Vermont Department of Health (VDH) has done an admirable job of producing clear, easy to understand statistics on the progression of Covid-19. 

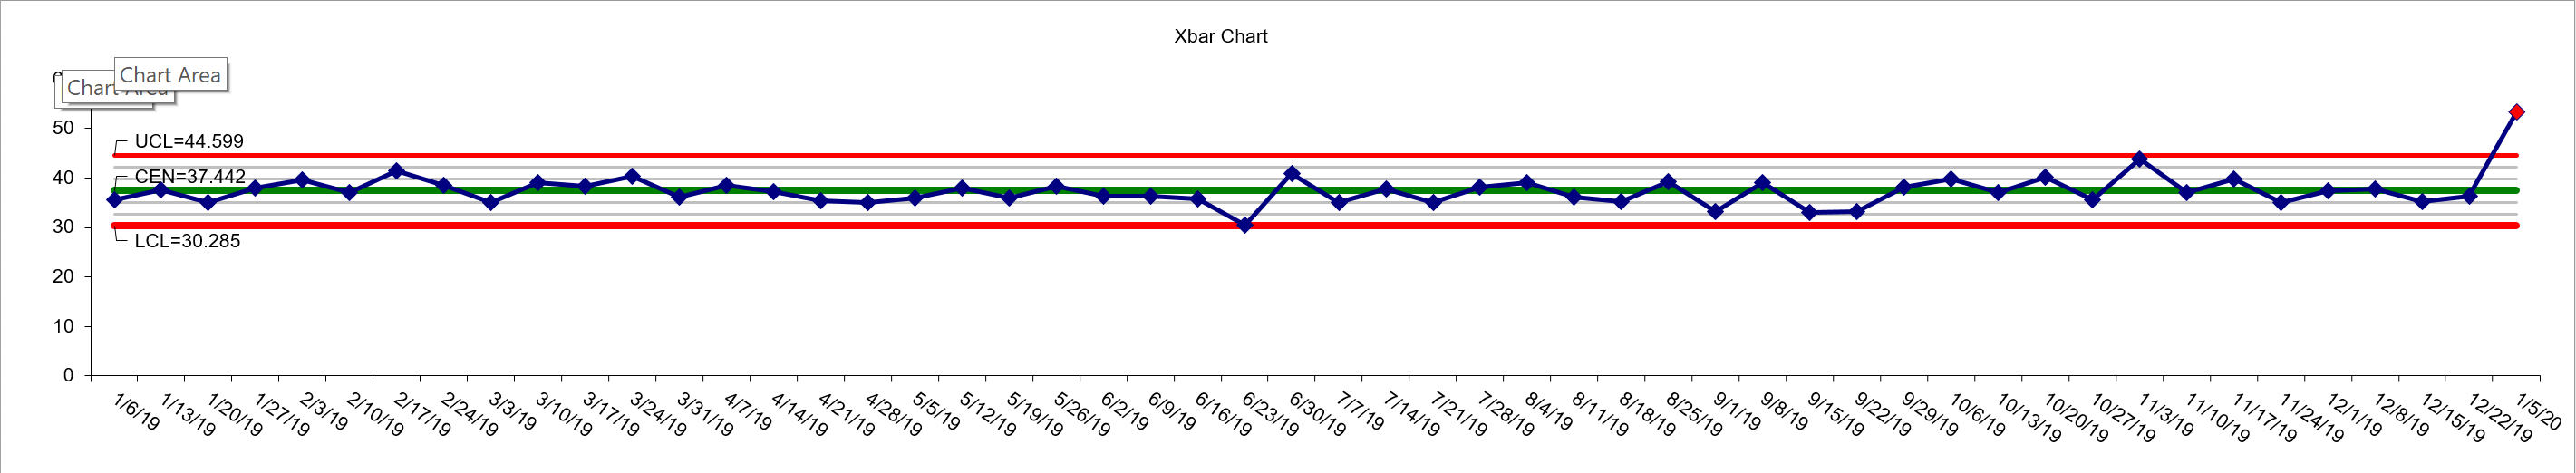
Unfortunately though, VDH (like most other health departments across the country) have utilized standard run charts to illustrate the progression. These are fine for representing a snapshot of the current situation, but are less useful when attempting to consider the likely progression from this point onwards. For that, we need a vehicle that represents the past data points, produces some kind of range based upon probability and uses both to not just analyze the varying infection rate, but can indicate if any given data point is outside the range of normal variation we could expect, given the prevailing circumstances. In short, we need a control chart. 

Predicting the Behavior of a Disease using a Control Chart

The history of the control chart emanates from the world of manufacturing and the works of Walter Shewhart in the 1930's. It has evolved to become a sophisticated and robust method for controlling quality in many situations. The underlying methodology analyzes variance between moving ranges of data points, and produces upper and lower control limits based on formulae, which show the limits within which any given data point will reside ~98% of the time in normal circumstances ("Normal" Variation). It also shows by a series of rules applied to data points when any given data point (or set of data points) is exhibiting behavior that is outside of the normal variation ("Special Cause" Variation). Many good books have been written on this subject, one of the more recent being Measures of Success by my fellow quality scientist Mark Graban. In this book, Mark lays out the history of the control chart, and its application in healthcare fields. It's simple, easy to digest and well recommended by this author. 

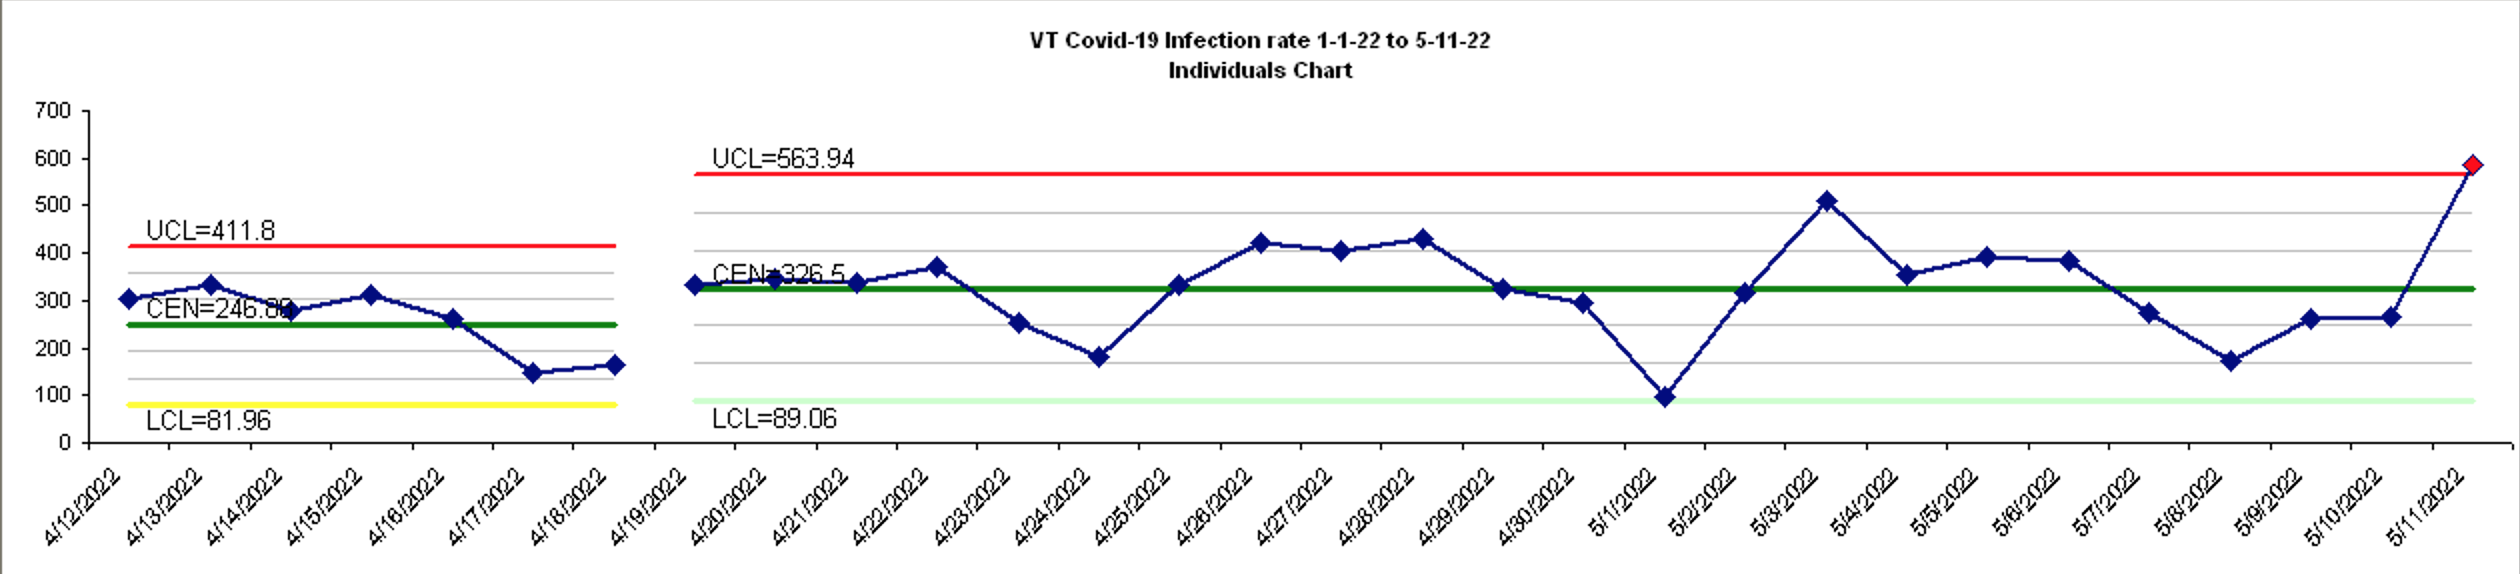
The Vermont Covid-19 Infection Rate as a Control Chart

This is the progression of the Vermont Covid-19 infection rate from mid April 2020 to present day. You can see the relatively stable starting phase, which was the tail end of the initial surge in cases. The second phase was post lockdown, when almost no-one was moving, working or socializing. The third phase was the discovery of a new cluster of cases in Winooski, and the fourth phase is the progression of mostly day to day infection rates, but with two additional clusters producing spikes also. You can see that in each phase, control limits are calculated which define the range of normal variation. In the third phase, these are very wide. In the second phase, narrow. In the world of quality science, we use these ranges to indicate if a variable is in or out of control. 

This method has its limits though. It is not a panacea or magic bullet. Its main purpose is to show when any given data point warrants an investigative or corrective response. The rules I mentioned previously govern which points should be investigated and which should not be. The Infection Rate is the output of a complex system (the world), with multiple variables affecting the rate in simple and complex ways. In the quality world, we would use this to indicate when corrective action was necessary and then instigate investigations into root causes for potential improvement using fishbone diagrams, driver diagrams and other tools. I would like to think that someone is going down this pathway with the Covid-19 infection rate in VT, but I have seen no evidence of that. 

Conclusions

Using a control chart rather than a straight run chart to represent the Covid-19 Infection Rate is more useful to the public and epidemiologists alike, as it shows not just the point to point progression, but also the severity of variation between points and therefore, if corrective action should be undertaken. It provides the data against the often expressed sentiment of "The rate is down to Zero! We've done it! We've controlled the Infection rate! Everyone back to work, socializing, normality". It shows that any given data point exists not in isolation, but in the latest of a sequence of outputs from a constantly varying complex system, governed by rules. Those rules can be used to show if any given data point needs to be investigated further, and more to the point, if it DOESN'T need investigating further. I hope to see the use of this tool expand in health departments nationwide. In the meantime, I'll continue to keep this chart up to date and post on this site. 

If anyone needs clarification on anything in this article, please contact me at This email address is being protected from spambots. You need JavaScript enabled to view it.


Capabilities

  • Category: Uncategorised
  • Published: Tuesday, February 18 2020 17:44
  • Written by Super User
  • Hits: 3715

Bryan Research has developed several advanced capabilities in our time in existence. These cross over vertical markets, and are listed here. 

Surveys.

We are skilled at the design, creation, execution, analysis and reporting of online surveys. We can do them for any scale from a small, 5 question straight survey through to a 100 question, multi conditional branched survey. 


Demand Analysis and Management

  • Category: Uncategorised
  • Published: Thursday, March 05 2020 08:55
  • Written by Super User
  • Hits: 3607

Most medical practices handle demand from patients and other sources with traditional scheduling systems. 

These systems (with minor variations) work on similar principles:

  • Lay out a practice visit calendar to represent patient visits scheduled on any given day. The front desk staff typically administer this, or sometimes if the volume merits it, specific scheduling staff. 
  • Establish a staff hours roster, where all staff (but especially providers) layout the hours they wish to work on what days.
  • Establish a set of guiding protocols and rules whereby patients are scheduled
  • If no capacity exists when a patient requests it, that patient is put off to another open slot, typically days or weeks into the future. 

This is the root cause of waiting lists, which in our experience have universally extended into not just weeks, but months for patients to be seen for routine appointments. 

At Bryan Research, we have spent the better part of 25 years figuring out a better way. Taking the robust analytical toolset from Six Sigma and Statistical Process Control, we developed a method for measuring and analyzing demand which has been deployed in many clients now. 

Understanding demand is the first step to segmenting it and establishing sets of operating protocols which imprint adaptability into your practice. This chart represents demand on a fictitious practice for 2019 and the first weeks of 2020. We teach how to construct the chart, how to interpret it, how to systematize it in your practice management system and how to enable managers and owners to utilize it as a central component of your demand management system. 

Results can be astonishing. Patient wait lists can be reduced by 90%, and eventually get to the holy grail of open scheduling. If this interests you, please don't hesitate to contact us at This email address is being protected from spambots. You need JavaScript enabled to view it. or (802) 870 3433 for a complementary initial discussion. 

Surveys

  • Category: Uncategorised
  • Published: Tuesday, February 18 2020 17:32
  • Written by Super User
  • Hits: 3849

Bryan Research has developed and utilized advanced online survey capabilities for the last two decades. 


Photo by Headway on Unsplash

We have the capability to design, engineer and execute surveys for clients with all the sophistication you would expect of a modern day research organization.

When you want a survey carrying out, we work with you to design the appropriate survey, including question types, groups and analytics. We evaluate and gather data on your target population for the survey, code them up and submit the survey to them. We provide personal support services to maximize survey completion rate and undertake advanced analytics on the results. These are all presented in a comprehensive report, along with source files so you can carry on the work with your survey group. 

It's a soup to nuts solution, and we're excited to bring it to you. Contact us at This email address is being protected from spambots. You need JavaScript enabled to view it. or (802) 870 3433 to find out more. 

Testimonials from our Clients